A diagram is a two-dimensional geometric symbolic representation of information according to some visualization technique. Sometimes, the technique uses a three-dimensional visualization which is then projected onto the two-dimensional surface. The word graph is sometimes used as a synonym for diagram.
The ability to read and interpret diagrams is crucial in geometry. Diagrams are used not only to illustrate a problem. These are also used in proving theorems and describing real-life situations. Here are some examples.
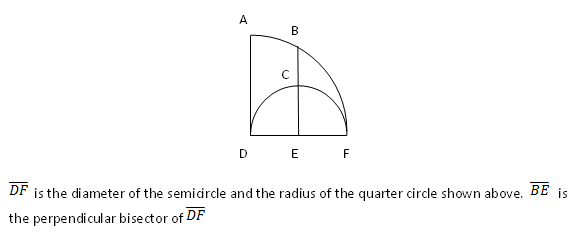
Example:
Try these questions
The area of triangle ABC is 40 square feet. The length of the line segment BD is 1/4 of the line segment AB. The length of the line segment EC is 1/3 of the line segment AC.
Refer to the diagram below.
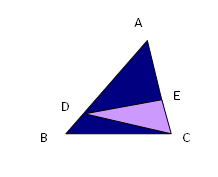
- What is the area of triangle ADC?
Answer:
Since the area of triangle ABC is 40 square feet, and triangle ADC is ¾ of triangle ABC. The area of triangle ADC is ¾ of the area of triangle ABC, that is ¾ x 40 = 30.
- What is the area of the shaded triangle CDE?
Answer:
As we have found in the previous problem, the area of ADC is 30. And since triangle CDE is 1/3 of triangle ADC, the area of CDE is 1/3 of the area of ADC, which is 1/3 x 30 = 10.