A diagram is a two-dimensional geometric symbolic representation of information according to some visualization technique. Sometimes, the technique uses a three-dimensional visualization which is then projected onto the two-dimensional surface. The word graph is sometimes used as a synonym for diagram.
The ability to read and interpret diagrams is crucial in geometry. Diagrams are used not only to illustrate a problem. These are also used in proving theorems and describing real-life situations. Here are some examples.
Example:
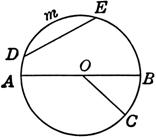
A circle is a geometrical shape with all its points being equidistant from the center. Look at the diagram below.
The distance from any point to the center is called the radius. In the circle below, OC, OA and OB are the radii (plural of radius).
The distance across a circle passing through the center is called the diameter. In the circle below it’s AOB. A diameter is essentially, twice as long as the radius.
The distance between any point in the circle, is called the chord. This means that the diameter, radius and any other lines connecting two points across a circle are chords. In the circle below it’s AOB, OC, OA and OB, DE and AOB.
The center of this circle is O.
The distance around a circle is called the circumference. In the circle below, it’s m.
Try these questions
Study the circle below and answer the following questions. The line AOB is 24 cm.
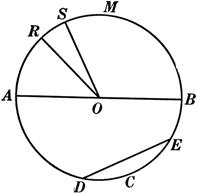
- Cite all the chords that isn’t a diameter.
Answer: All the lines connecting two points in a circle such as the AO, RO, SO, DE, AO, BO. AOB is the diameter.
- What is the radius measure of the circle?
Answer: The diameter, AOB is 24 cm.
The radius is half the diameter: 24 / 2 = 12cm
- Which chord is not neither a radius nor a diameter?
Answer: DE because it doesn’t pass through the center.
-
What is the circumference of the circle?
Answer: m.