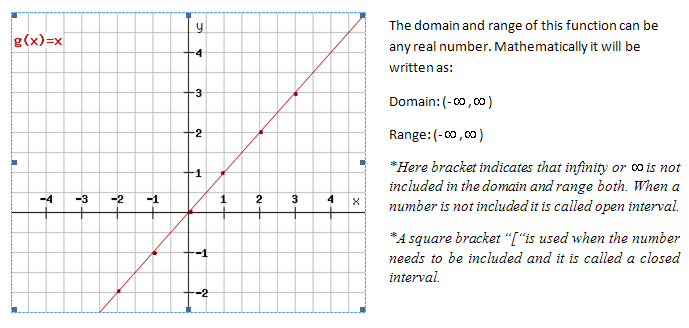
A function in which the maximum degree or power of the dependent variable is one is called a linear function and its graph will always be a line. The most basic linear function is: y=x.
Graphs
To plot the graph of a function, we first plot a set of ordered pairs that satisfy the given equation and then join them to form a smooth line. The ordered pairs for this equation will be (1, 1), (0, 0), (2, 2) etc. The graph is shown below:
How will the graph change if we have an equation of the type y=k x?
Consider 2 cases
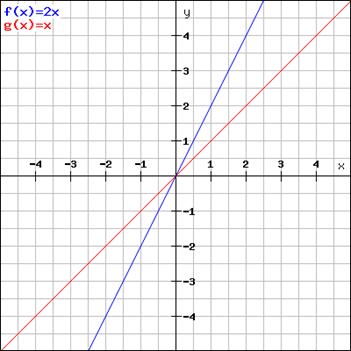
- If k >1, then the absolute value of y will always be greater than x except when x =0. This means the value of y will increase faster for positive x compared to the graph y=x for the same change in the value of x. We can understand this better once we plot its graph.
Let y=2x
Graph of y=2x moves closer to the y axis compared to the graph of y=x
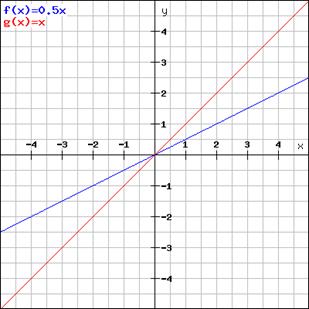
- If k < 1, then the value of y will always be less than x except when x =0. This means the value of y will increase slowly compared to the graph of y=x for the same change in the value of x.
Let y=0.5x
X |
Y |
0 |
0 |
1 |
0.5 |
-1 |
-0.5 |
2 |
1 |
Graph of y=0.5x moves away from the y axis and closer to the x axis compared to the graph of y=x
Example
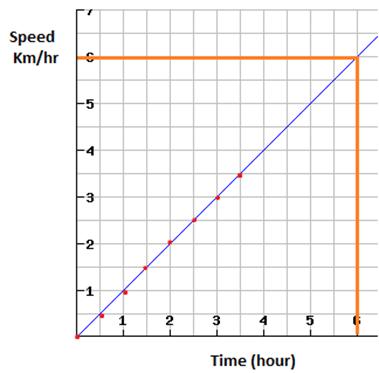
Plot the graph for the same statement as in example 3, “The speed of a car increases by 0.5 km/hr after every 30 minutes.”. How can we predict the speed after 6 hours?
Answer:
To plot the graph, we need a set of ordered pairs.
Time (t) – hrs |
Speed (s) (km/hr) |
0 |
0 |
0.5 |
0.5 |
1.0 |
1.0 |
1.5 |
1.5 |
2 |
2.5 |
We get the following graph
Predicting values from graphs
Graphs can be used to find the value of a dependent variable for a given value of an independent variable. To find the value of speed at t= 6 hours from the graph, we draw a vertical line at t=6 .Suppose it meets the graph line at point A. From there we draw a horizontal line towards the y axis. The point where this line meets the y axis is the value of speed at t=6 hours.
Also it can be seen that as time increases by 0.5 hours, speed increases by 0.5 km/hr and at any time value of speed s=t.
Example
The growth rate of the two companies between the year 2000 and 2009 is shown. Answer the questions below
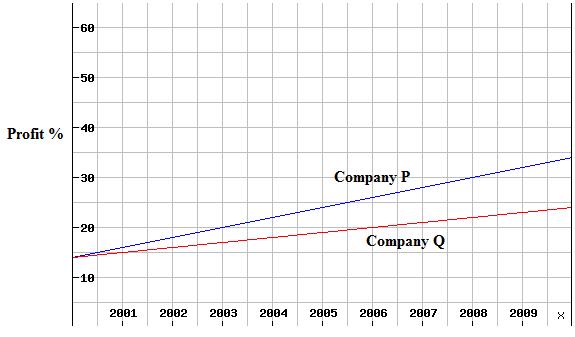
- Which company has better growth rate and why?
Answer:
It will be the company whose graph has a steeper line. Since the graph of company P is steeper than that of B, it means for same change in x i.e. number of years, the profit of company P is greater than that of Q.
- Approximately how much more profit does Company P make than Q in the year 2005.
Answer:
In 2005, P’s profit = 24% (approx) and Q’s profit = 19% (approx)
Hence P’s profit is 5 % more than Q’s.
Equation of a Line
A linear function is written as y=mx + b where m is the slope of the line and b is its y intercept. This form of the equation of a line is called slope intercept form. To find the equation of a line in this form we need to know the slope and y intercept.
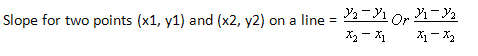
If the change in value of x given by ∆x changes the value of y by ∆y then the ratio of ∆y / ∆x is called the slope of the function. It represents how the value of y changes with a change in the value of x. The slope can be negative, positive or zero. In the case of a line this slope is constant between any pair of x and y values on the line.
We can also find the equation of a line when we know its slope and any point that lies on the line.
If its slope is m and (x1, y1) is a point on the line then the equation of the line is given by:
(y – y 1)=m (x - x1).
This is called point slope form and it can easily be transformed to represent the line in slope intercept form by using simple mathematical operations.
Example
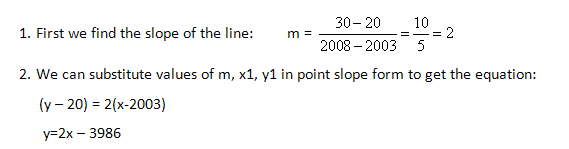
For the graph shown above, we can find the equation of the line for company P by finding any two points on the line. The two points that we choose should be accurate. We can take points (2003, 20) and (2008, 30).
The third form of expressing a line is the standard form, for any linear equation, ax + by= c. As an example take the equation y = ¾ x -2.
This line expressed in the 3 forms of equations is as follows:
Slope intercept form: y = ¾ x -2; it was given in this form.
Standard form: 3x -4y = 8; to get to this form multiply the equation by 4: 4y = 3x – 8
Then move the x and y components to the same side of the equation:
3x – 4y – 8 = 0
Add 8 to both sides of the equation: 3 x – 4y – 8 + 8 = 8
3x – 4y = 8
Point slope form: y – 1 = ¾(x – 4); Find a point on the line: (4, 1) is on the line, so x1 = 4, y1 = 1
Slope = ¾ from the slope intercept form of the line
Try these questions
- For the function given below, what are the possible values of y?
Y = 8x -29; x is a real number greater than or equal to 0
- Only positive real numbers
- Only negative real numbers
- Real numbers >- 29
- Real numbers ≥ -29
Answer: D
For the data table given below, answer questions 2 and 3
Year |
|
1995 |
3000 |
1996 |
3400 |
1997 |
3600 |
1998 |
3750 |
1999 |
4000 |
2000 |
4500 |
- The speed of a car initially is 10 km/hr. The speed gradually increases at the rate of 5km/hr every 0.2 hrs till it has reached a speed of 50 km/hr. Identify the function for the speed of the car in km/hr (s) with time t (hour)
- 10 + 25x
- 10 + 2.5x
- 10 + 5x
- 10 + 0.2x
Answer: D
- During their first year of life, swordfish increase in weight at a regular rate. A swordfish weighed 14 pounds at the age of one month and 28 pounds at the age of 2 months. What was its weight at the age of 6 months?

- 76
- 84
- 94
- None of the above
Answer: B
- For an increment of 1 in the value of x, the value of y at least quadruples. Which of the following best represents this?
- Y= 2x+2
- Y=4X +1
- Y= 4x
- Both B and C
Answer: D