A square root function is written as
y=  where f(x) is a linear function and a ≥ 0 where ‘a’ is any value in the domain of y.
To plot the graph of a square root function, we need to know the set of ordered pairs. The main thing to remember is that the square root of a negative number is not a real number; therefore, the domain of a square root function only takes a positive value greater than or equal to zero.
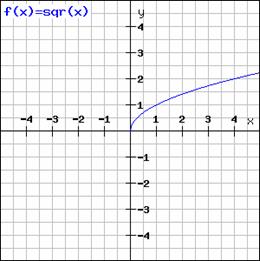
The most basic square root function is y=√x. Its function table is given below:
| X |
y =√x |
y(x+1) – y(x) ; x>0 |
0 |
0 |
0 |
1- |
1 |
1 |
2 |
1.414 |
0.414 |
3 |
1.732 |
0.318 |
4 |
2 |
0.268 |
We can see that as the value of x increases by 1, the difference between successive values of y decreases. This means that the slope of the graph decreases as we increase x. The graph of the square root function is given below:
Graphing Other Square Root Functions
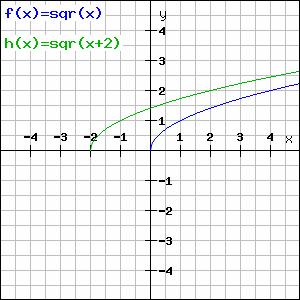
Once we know how to plot the graph of the basic square root function, we can easily graph other square root functions from the graph of the parent square root function, i.e. y = √x. It is called a parent function because other graphs derived from it can be considered its child functions.
Example :
The graph of y =  +a can be easily derived from the graph of its parent function y =√x.
CONDITION |
RESULT |
COMMENTS |
When h>0 |
Translate graph towards left |
For the same l value of x, the value of y is more when compared to the parent graph. |
When h<0 |
Translate graph towards right |
For the same l value of x, the value of y is less when compared to the parent graph. |
When a>0 |
Translate up by a units |
|
When a<0 |
Translate down by a units |
|
Example:
Graph the function y= 
Try this problem
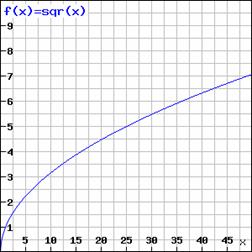
1. Find the approximate value of  from the following graph.
- 5.4
- 5.5
- 5.3
- 5.8
Answer: D
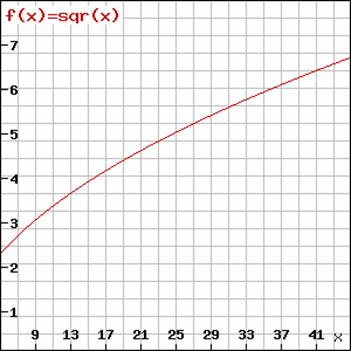
2. For the graph given below, find the approximate value of √40.
- 6.5
- 6.2
- 6.4
- 6.6
Answer: C
Explanation :
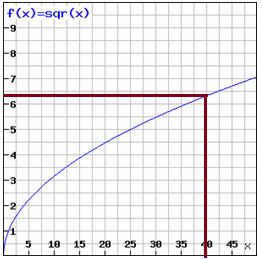
Y=√x
When x is 40, y ≈ 6.4.
Hence, √40 ≈ 6.4.