In the earlier section, we learned to draw the graphs for linear equations in two variables and solve simultaneous equations with two unknowns.
The graph of a linear equation is a straight line, whereas the graph of a linear inequality is a region.
Example 1
Observe the following straight line graph x = 3
When we plot x = 3, we can see that it is parallel to the y-axis.
This straight line separates the lines into two half planes and the line itself does not belong to any of the half planes. The straight line cuts the x-axis at the point (3,0).
For any point in the plane, the following three alternatives are possible.
- It may be on the line.
- It may be in the half plane I.
- It may be in the half plane to the left of the line.
- If we move to the left side of the line, we find that the coordinates are decreasing.
- If we move to the right side of the line we find that the coordinates are increasing.
Therefore, we can say that the half plane to the right side of the straight line x = 3 consists of the coordinates whose x-coordinates are greater than 3.
x 3 denotes the region, which is shaded.
When we plot the graph x 3, the boundary line x = 3, is not included. The region is known as an open half plane. It is shown as a dotted line.
Observe the graph of x >= 2 in the Cartesian plane.
The graph x >= 2 satisfies all of the points that lie on the straight line x = 2 or x > 2, i.e., the half plane to the right of the straight line x = 2, i.e., all ordered pairs (x,y)/x = x and (x,y)ɛ R and (x,y)/x > 2 and (x,y) R, i.e., the union of two sets.
In this graph, we plot x >= 2, which means that the boundary line x = 2 is also included. The region is known as a closed half plane and is shown as a heavy dark line.
Location of the Origin Relating to Various Plane Regions
The coordinates of the origin are ( 0, 0 ). To determine whether or not the origin lies in the region represented by the graph, we substitute the coordinates of the origin in the graph represented by it.
- If the subsequent inequality is true, then the origin lies in the region represented by the graph.
- If the subsequent inequality is false, then the origin does not lie in the region represented by the graph.
Example 1
Draw a graph for y > 3x + 2
To draw this graph, first we draw a straight line y = 3x + 2 by substituting the values of x to be 0, 1, 2 etc.
x 0 1 2
y 2 5 8
Substitute ( 0, 0 ) in the inequality y > 3x + 2.
0 > 0 + 2, is false, which means that the origin does not lie in the region represented by the graph.
Therefore, y > 3x + 2 represents the region as shown above (other than the origin side).
Example 2
Draw the graph for y > 5
Solution:
Draw the graph for y = 5 on the graph paper. The boundary line is shown by small dashes because it is not included.
To determine the region represented by the graph y > 5
- Substitute the coordinates of the origin in the inequation of the graph.
- 0 > 5, which is false.
- The origin does not lie in the half plane represented by the graph.
The half plane, which is solution set of the inequation y > 5, is indicated as the shaded region in the graph.
Example 3
Draw the graph for y >= x + 4
- Draw the graph for y = x + 4. The line divides the entire plane into two half planes. Every y point on the line satisfies this equation.
We next determine whether or not the origin lies in the region represented by the graph.
Substitute the coordinates of the origin (0,0) in the inequation y >= x + 4, and we get the following.
y >= x + 4
0 >= 0 + 4
0 >= 4, which is false.
- The origin does not lie in the half plane represented by the graph.
The boundary line y = x + 4 lies in the region represented by the graph, and is drawn as a heavy dark line. The region indicated by the graph is shaded.
- Its solution set is {(x,y) / (x,y) ɛ and y > x + 4}
Try these questions
1. State whether the following are true (or) false.
- A straight line separates a plane into two half planes and the straight lines does not belong to it.
Answer: True
- The origin ( 0, 0 ) belongs to region indicated by the graph 4x + 2y < 5.
Answer: True
- The point ( 4, 5 ) belongs to x + y ≤0.
Answer: False
- The point ( 5, 5 ) belongs to x < y.
Answer: False
- The line y = x + 2 is the boundary line for the region y ≤ x + 2.
Answer: True
2. Shade the region on a graph paper, which represents the solution, set of following inequations.
- x > 5
Answer:
All points whose x coordinate is greater than 5 belong to the region. The shaded open half plane represents x > 5
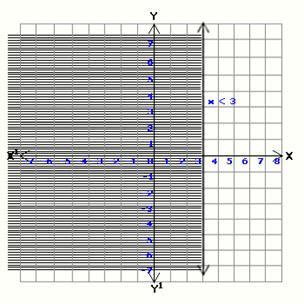
- x < 3
Answer:
- x + y < 2
x + y = 2
X 0 2
Y 2 0
Answer:
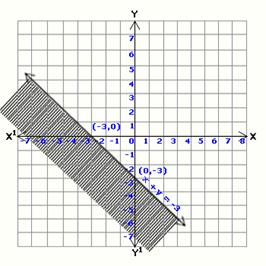
- x + y + 3 < 0
x + y + 3 = 0
X 0 -3
Y -3 0
Answer: