Recursive Multiplication Model
Exponential equations can represent a recursive model. As for the example shown above, the population of the
daughter cells is always double the previous number of daughter cells. Such a pattern or sequence in which the
subsequent number is a multiple of a previous number and a constant value is a recursive multiplication model.
For example, consider the following pattern: 3, 9, 27, 81 ….
If x is the sequence number and y is the value at that sequence number, then we can relate the two values as shown
in the table below:
X |
Y |
1 |
3¹ |
2 |
3² = 3¹ x 3 |
3 |
3³ = 3² x 3 |
4 |
34 = 3³ x 3 |
It is the exponential rule, that when bases are the same, the powers are added.
Using this recursive rule, we can find the value of any number in the sequence. The nth number will be given by 3n
where n is a positive integer greater than 0.
= 8
Example
The cost of a car depreciates by 15% every year. If its original cost was $20,000, formulate the recursive
multiplication model that represents its cost after n years.
Solution
|
Cost |
0 |
20,000 |
1 |
20,000 - .15 x 20,000
=20,000 (1 - 0.15) |
2 |
20,000 (1 - 0.15) - 0.15 (20,000 (1 - 0.15))
=20,000 (1 - 0.15)(1 - 0.15) = 20,000 (1 - 0.15)2 |
If we observe the pattern in the cost of the car after n years, it will be 20,000(1-0.15)n.
Therefore, if the cost after n years is C(n) then C(n) = 20,000(1-0.15)n which is the recursive multiplication model.
Asymptote of logarithmic and exponential graphs
The asymptote for log bx is the y axis by definition of the logarithm function when x =0:
-
Exponential Function
Y = ax
This function is defined for a > 0 and a! = 1. 'a' cannot be 1 because 1 raised to any power gives 1 only.
Hence the domain of ax is all real numbers and the range is the set of all real positive numbers, i.e. y > 0 because
a > 0.
Exponential Delay Function
When 0 < a < 1, then it is defined as an exponential decay function. As the of x increases, the corresponding
value of ax decreases. Its graph is shown below.
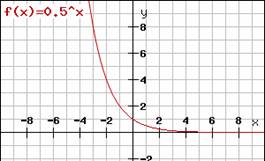
Asymptote of ax is the line parallel to the x axis because, as x tends to -∞ , y tends to zero.
-
Logarithmic Function
Y = ax can be written as x=logay
x = loga0
Domain of logay is the set of all numbers greater than zero, i.e. y > 0, and the range is the set of all real numbers.
Also, the base a > 0 and a!=1 (it is the same 'a' as in the exponential function above).
Asymptote of y= logax is the line parallel to the y axis as seen from the graph.
Graph of the type ax-h + k
|
Condition on h |
Condition on k |
Graph translation |
1 |
h>0 |
k=0 |
Translates along the positive x direction by h units. |
2 |
h<0 |
k = 0 |
Translates along the negative x direction by h units. |
3 |
h=0 |
k>0 |
Translates along the positive y direction by k units. |
4 |
h=0 |
k < 0 |
Translates along the negative y direction by k units. |
5 |
h>0 |
k>0 |
A combination of steps 1 and 3, i.e. translation along the positive x axis by h units and along the positive y axis by k units. |
Example
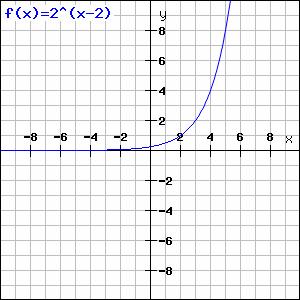
Draw the graph for2x-2 - 3.
Solution
Step 1: Draw the graph of 2x |
Step 2: Move right by two units |
|
|
Step 3: Move down by 3 units |
|
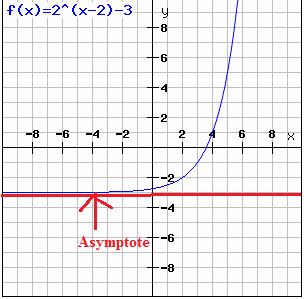
|
|
We can also derive the graph of various forms of logarithmic functions such as log2(y+a)+b from the basic graph
of log2(y) as shown below.
|
|
| The graph of log2(x+2) moves the graph of log2(x) by 2 units to the left from (1,0) to (-1,0) |
The graph of log2(x-1) moves the graph of log2(x) by 1 unit to the right from (1,0) to (2,0) |
|
|
| The graph of log2(x) +4 moves the graph of log2(x) +4 by 4 units up from (0,-4) to (0,0) |
The graph of log2(x) -3 moves the graph of log2(x) down by 3 units from (0,-4) to (0,-7) |
Conclusion
-
Log(x-a) can be obtained from the graph of log(x) by shifting the graph of log(x) to the right by a units.
-
Log(x+a) can be obtained from the graph of log(x) by shifting the graph of log(x) to the left by a units.
-
Log(x) +k can be obtained from the graph of log(x) by shifting the graph of log(x) up by k units.
-
Log(x) - k can be obtained from the graph of log(x) by shifting the graph of log(x) down by k units.
Try these problems
-
Find the domain of f(x) = log10{1−log10 (x2−3x+12)}
a. x < 1
b. x <2
c. x>2
d. 1
Answer: D
Explanation :
Here are the two logarithmic functions, let us call them the inner and the outer one's to find the domain of the
function. Both the functions must be positive.
Let f(x) =1−log10 (x²−3x+12 ), thus the given function = log10 (f(x)).
So 1−log10(x²−3x+12 ) > 0,
i.e. log10(x²−3x+12 )< 1 or log(x²−3x+12 ) < log10 (10).
=> x²-3x+12<10
x²−3x+2<0
=> (x−1)(x−2)<0
Either x <1 and x>2 which is not possible
or x>1 and x<2 so that (x-1)(x-2) is negative.
=> x ε (1,2)
Also, for log(f(x)), (x²−3x+12 ) > 0,
x²−3x+12 is positive for all the real numbers.
So the domain of the function is the intersection of the two functions which is (1,2).
-
Solve the inequality log 9x=3/2.
a. 27
b. 729
c. 3
d. 81
Answer: A
Explanation :
Log 9x=3/2
Solution :
X=(9)3/2
X=((3)2)3/2
X=(3)3
X=27