A bivariate data set uses a scatter plot to interpret the relationship between two variables. The scatter plot can suggest various kinds of correlations between variables with a certain confidence interval. If the pattern of dots slopes from lower left to upper right, it suggests a positive correlation between the variables being studied. If the pattern of dots slopes from upper left to lower right, it suggests a negative correlation. A line of best fit, alternatively called trendline, can be drawn in order to study the correlation between the variables. An equation for the correlation between the variables can be determined by established best-fit procedures. For a linear correlation, the best-fit procedure is known as linear regression and is guaranteed to generate a correct solution in a finite time.
One of the most powerful aspects of a scatter plot, however, is its ability to show nonlinear relationships between variables.
Nonlinear Relationships
Nonlinear relationships, in general, are any relationship which is not linear. Each unit change in the x variable will not always bring about the same change in the y variable. The graph of this relationship is usually a curve instead of a straight line.
This graph below shows a linear relationship between x and y.
This graph below shows a nonlinear relationship between x and y.
A curvilinear relationship can be modeled by an exponential or a quadratic function. To determine which function is a better fit to a bivariate set, one needs to understand the graphs and relationships that the two functions characterize. Also, determining a formula for a curve of best fit requires a graphing calculator or similar technological tool.
Exponential |
Quadratic |
y= abx |
y = ax2 + bx + c |
Describes exponential growth or decay |
Describes real-life situations |
The scatter plot is upward-sloping and always lies above the horizontal axis. |
The scatter plot is parabolic in nature. |
Example
Given the bivariate data below, graph the stopping distance with respect to speed in a scatter plot. Find the best fit and predict the stopping distance if a car was traveling 120 miles per hour.
|
Stopping Distance (in feet) |
|
|
mph |
Stopping distance |
1 |
10 |
25 |
2 |
15 |
42 |
3 |
20 |
61 |
4 |
25 |
83 |
5 |
30 |
107 |
6 |
35 |
133 |
7 |
40 |
162 |
8 |
45 |
193 |
9 |
50 |
227 |
10 |
55 |
263 |
11 |
60 |
301 |
12 |
65 |
342 |
13 |
70 |
385 |
14 |
75 |
431 |
15 |
80 |
489 |
16 |
85 |
529 |
17 |
90 |
582 |
18 |
95 |
637 |
19 |
100 |
694 |
Using the data we have this scatter plot.
Suppose the relationship is linear, the best fit line has a linear equation y = 7.4375x - 108.33.
However, if we look closely, the relationship is actually curvilinear, in other words, nonlinear. We now want to know whether an exponential or a quadratic function makes a better fit and model for the data set.
Using graphing software, we can determine an exponential and a quadratic function that best fits the data.
Exponential
Quadratic
Comparing the two scatter plots, we can determine that the bivariate data set is better modeled by the quadratic function y = 0.0477x2 + 2.2108x - 2.3059.
Now, let us use the model to make a prediction. What is the stopping distance if a car was traveling 120 miles per hour?
y = 0.0477x2 + 2.2108x - 2.3059
y = 0.0477(120)2+ 2.2108(120) - 2.3059
y = 686.88 + 265.296 - 2.3059
y = 949.8701
Try these questions
- When a bivariate data set does not have a linear relationship, we say, it has no relationship. True or False.
Answer: False. It has a nonlinear relationship.
- The figure below shows the results of an experiment conducted by Galileo on projectile motion.
What can you say about the relationship between the two variables: Distance traveled and Release height?
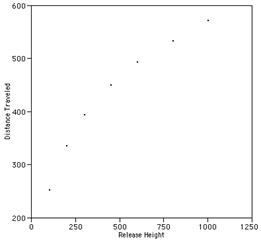
- It has a strong linear relationship
- It has a curvilinear relationship
- It has a nonlinear relationship
- B and C
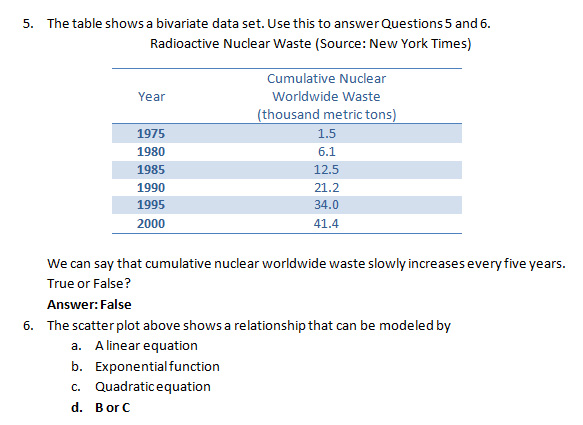
- The scatter plot above shows a relationship that can be modeled by
- A linear equation
- Exponential function
- Quadratic equation
- A combination of B and C
ANSWERS TO PRACTICE TEST QUESTIONS
- False. It has a nonlinear relationship. By definition of nonlinear relationship.
- D. B and C. In general, it has a nonlinear relationship. More specifically, a curvilinear relationship.
- C. Quadratic equation. Since the scatter plot does not characterize rapid growth and has a parabolic curve, we can say that it is likely to have a quadratic model as opposed to linear and exponential.
FINAL TEST QUESTIONS
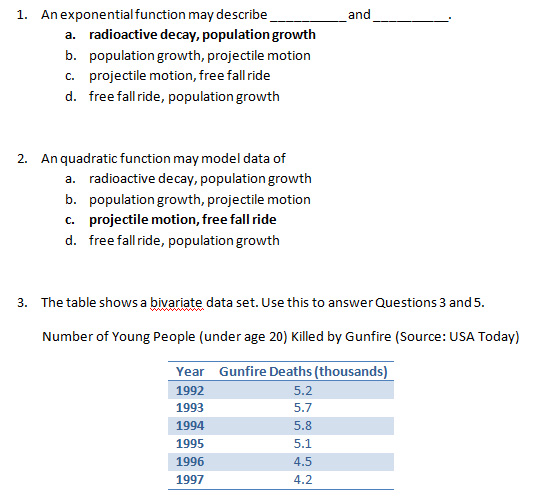
- Based on the data set provided by the table above, we can predict that the relationship is not linear. True or False?
Aswer: True
ANSWERS TO FINAL TEST QUESTIONS
- A
- C
- C
- True
- False
- D